Space Studio

Some structures only show their shape from the inside

The Space Studio is where you build. A surface with depth, connectors that carry meaning, and a whole document behind every node.

Why depth

A flat surface can only tell you two things

On a plane, an idea has a position and it has neighbours. That is the entire vocabulary available. Everything else you know about it has to be recorded somewhere else and carried in your head.

Add a third axis and those things become properties of the picture itself. Distance means something. Direction means something. A grouping holds together when you move around it, because it is a grouping in space rather than an accident of layout.

This is not a failing of flat diagrams. They are precise, portable and often exactly right. They simply run out of room to say things, and most people have been compensating for that quietly for years without ever calling it a problem.

Depth is the part of this category nobody else has needed, and there is a good reason for that. A graph you look at does not require it. A graph you're working inside does.

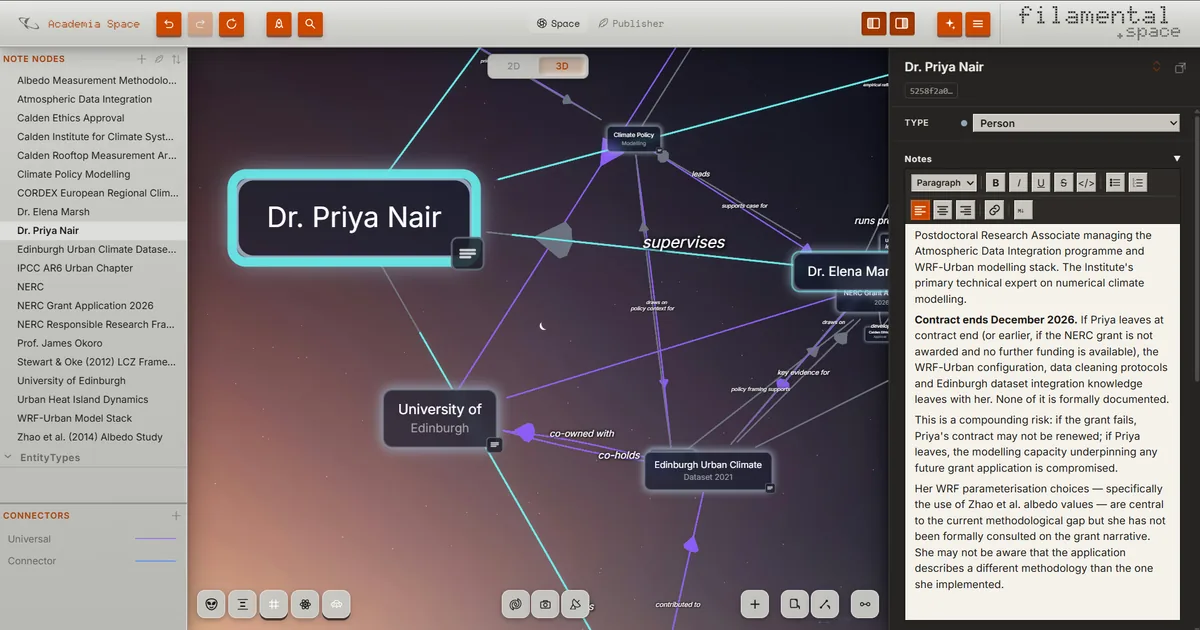
Depth doing the work People, institutions and datasets sitting at different distances, with supervises, co-owned with and key evidence for written along the arrows.
A research structure in Space Studio, viewed in 3D. Named people, institutions and datasets sit at different depths, joined by labelled arrows reading supervises, co-owned with, and key evidence for. The Lens sidebar lists every node and connector type; the right panel holds the selected person's full notes.
How it is built

It begins as a folder, and it stays one

There is no upload to regret later and no proprietary file to be trapped in. The structure is a folder of Markdown and conventional files that happens to know how it is arranged.

  1. Point it at a folder

    Start empty, load a Template, or ask an AI to draft the whole thing. Our templates are a vocabulary rather than content: node types and connector types, ready for you to fill. It exists to remove the blank canvas, not to hand you somebody else's structure.

  2. Double-click the canvas

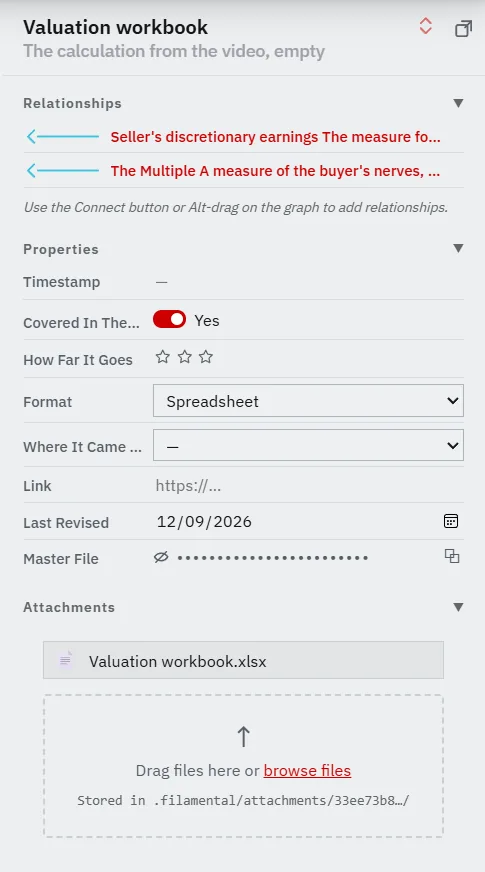
    That is a node. Type its title and it exists, as a real file in your folder from that moment on. Every node is a full document underneath: notes, attachments of any kind, properties and a classification you defined. Not a label with a tooltip behind it.

  3. Type a link and it takes you there

    Put [[a node name]] in any note and it becomes a working link to that node's page. It is a hyperlink rather than a connection, so nothing lands on the canvas until you decide it should. Links pointing at a node that does not exist are flagged rather than quietly ignored, and the ones that deserve to be drawn are the next step.

  4. Draw the ones that matter

    Hold ALT and drag from one node onto another, or use the connect button in the bottom bar. Then give it a type, a direction, a label and a weight.

  5. Let the physics find the shape

    Dark Energy is our auto-arrange and spreads everything into clusters according to what pulls on what.

    Layers sorts the same nodes into a hierarchy by type.

    Switch to 2D for a flat, readable diagram, and switch back for the depth.

    It is one structure seen from different vantages, never a second copy.

Your files never stop being files. Open one in another editor, save it, and the canvas updates while you watch. Hang a PDF, a spreadsheet or a drawing on a node and it opens in whatever you already use for it.

Connectors

A link that says how, which way, and how much

Most tools can record that two things are related. That is a single bit of information, and it is rarely the interesting one. Knowing that a person and a grant are connected tells you almost nothing. Knowing that she holds it, and that a dataset is key evidence for it, is the beginning of an actual picture.

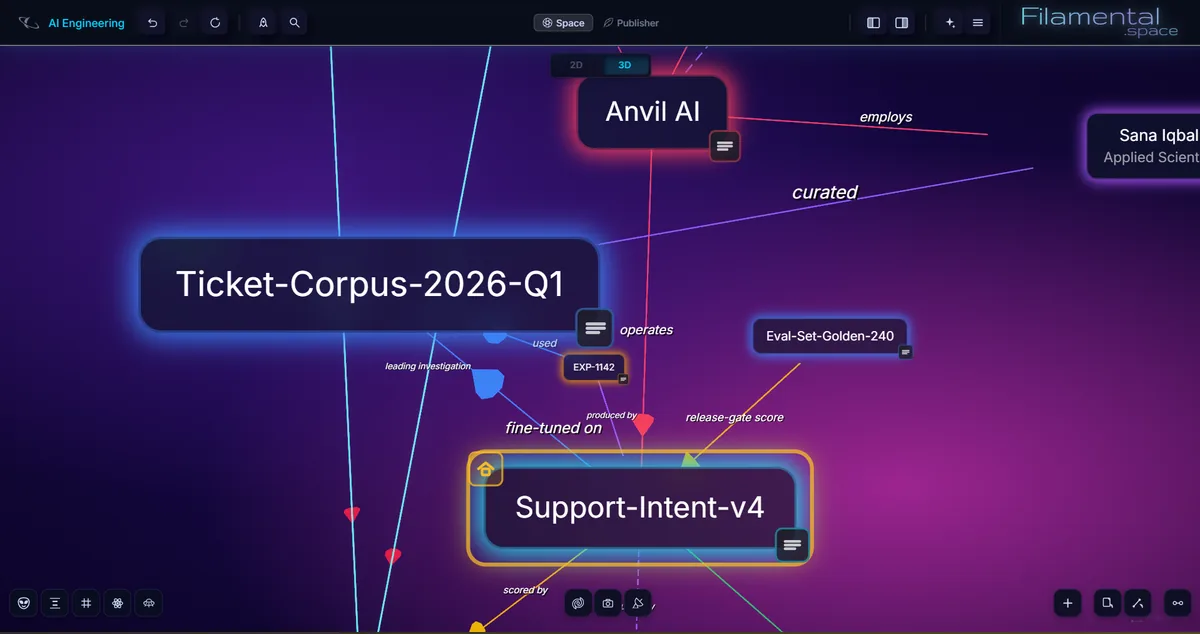
So a connector here carries four things: a type you defined, a direction, a label in your own words, and a weight that decides how hard it pulls in the physics. In the space below, the arrows themselves read fine-tuned on, produced by, release-gate score and leading investigation. That structure is making claims, not drawing lines.

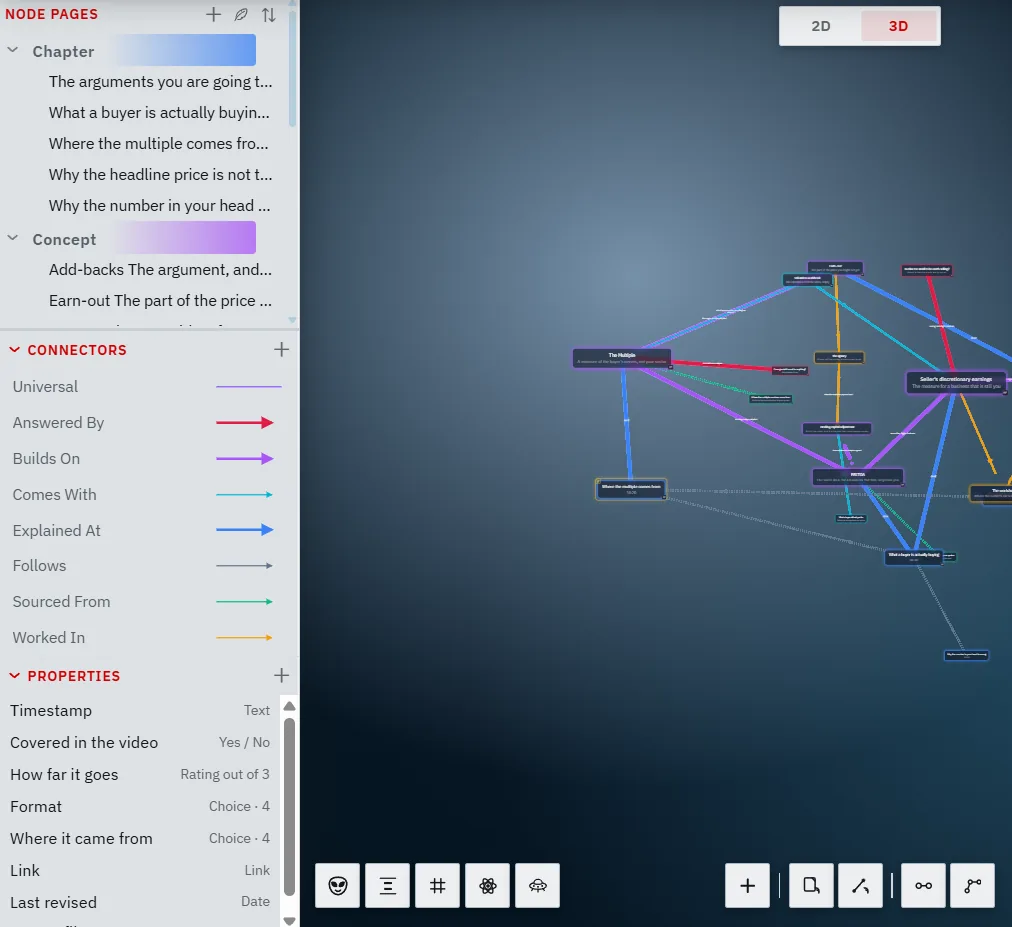
Node types work the same way. Nodes become Clients, Risks, Sites, Sources, Witnesses or whatever your field genuinely calls them, each with its own colour on the canvas. The result is a structure that speaks your vocabulary back to you, which is the difference between a diagram you have to translate and one you can simply read.

Every panel hidden, pushed in close Employs, curated, operates, fine-tuned on, scored by. With the interface out of the way, what is left is the relationships, spelled out.
The same AI engineering space with every panel hidden and the view pushed in close. Five nodes fill the frame and the relationships between them are labelled on the arrows themselves: employs, curated, operates, used, fine-tuned on, produced by, release-gate score, scored by, and leading investigation.
Scale

A space is a subject, not a container

You are not meant to keep one structure and feed it forever until it becomes an archive nobody can navigate. Make a space for the investigation, the client, the project, the year. Give each one a shape you can hold in your head.

When two of them need to meet, drop a Bridge between them and travel across with a double-click. Have as many spaces as you like and as many Bridges as you like on the free plan, permanently.

What you get is a distributed set of focussed structures joined in-situ, which is how most people's work is actually shaped. Each space holds up to twenty nodes on the free plan (roughly one finished piece of work). Professional removes the ceiling entirely.

There is a longer argument underneath this, about why work resists being filed while it is still moving.

Independence

Nobody is waiting on a return

Filamental has taken no investment. There is no board, no investor target to meet, and no eventual exit that the software has to cater to.

That sounds like a fact about us. It is really a fact about your next five years. Software built on raised money has to grow into that money, and the pressure arrives on your side of the screen as seats to count, credits to meter, tiers to climb, and features that serve the funnel rather than the work. None of that is bad faith by the people building it, it is arithmetic, and it is doing exactly what it was designed to do.

We simply do not have that arithmetic to do. So there is one price, no metering, no tracking and no gated AI resold to you at a markup. The only thing this software has to do is be worth keeping, to people who chose it deliberately. That is a much easier instruction to follow, and it is the reason the free plan is as complete as it is.

Make it yours

A space you keep open all day should not look like ours

Fifty-six backgrounds for the canvas, seven themes for the interface around it, any image you care to upload, and a Pexels search so you do not have to go and find one first.

By the time you read this, it's probably more.

Observation
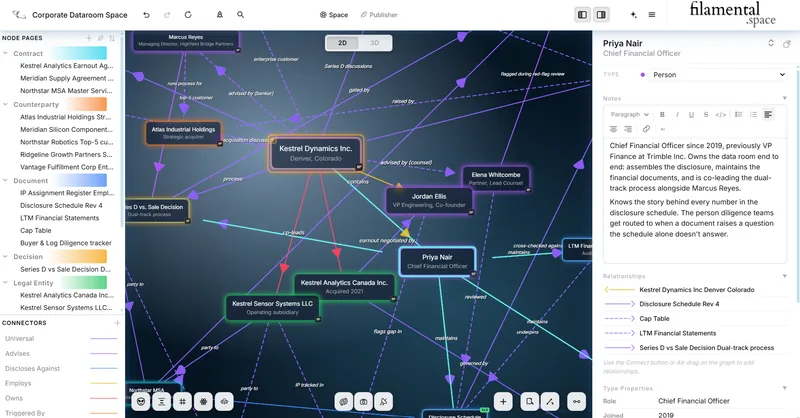
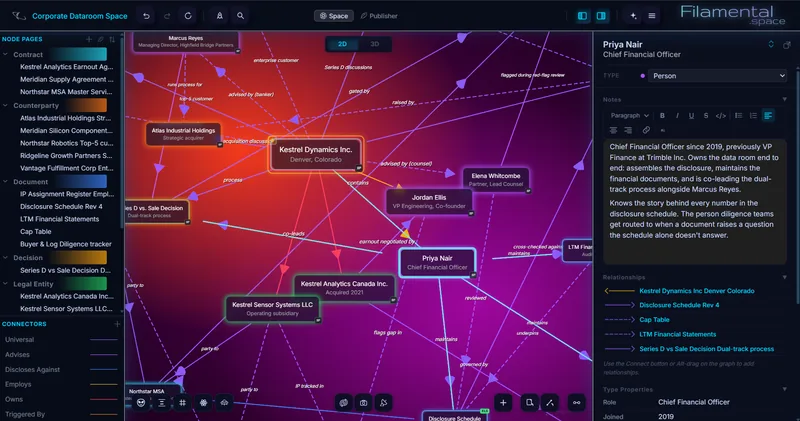
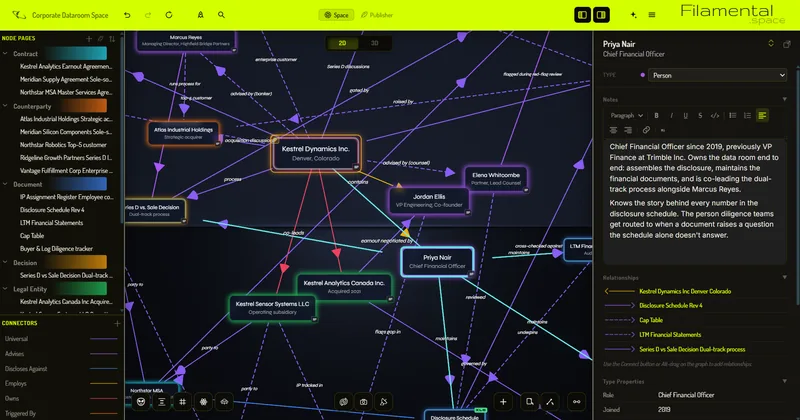
One space, different settings. Nothing in the structure moved.

Setting 01
A corporate dataroom structure on a deep blue-grey field, with pale interface chrome and a rounded typeface. Kestrel Dynamics Inc. sits at the centre, joined by labelled arrows to Atlas Industrial Holdings, Priya Nair and Kestrel Analytics Canada.
Setting 02
The identical structure from the identical camera position, now on a red field bleeding into magenta, with dark interface chrome and a different typeface. Every node, arrow and label is in the same place as before.
Setting 03
The identical structure again, on near-black, with an acid-green interface bar and a monospaced typeface. Nothing about the graph has moved; only the surroundings have.

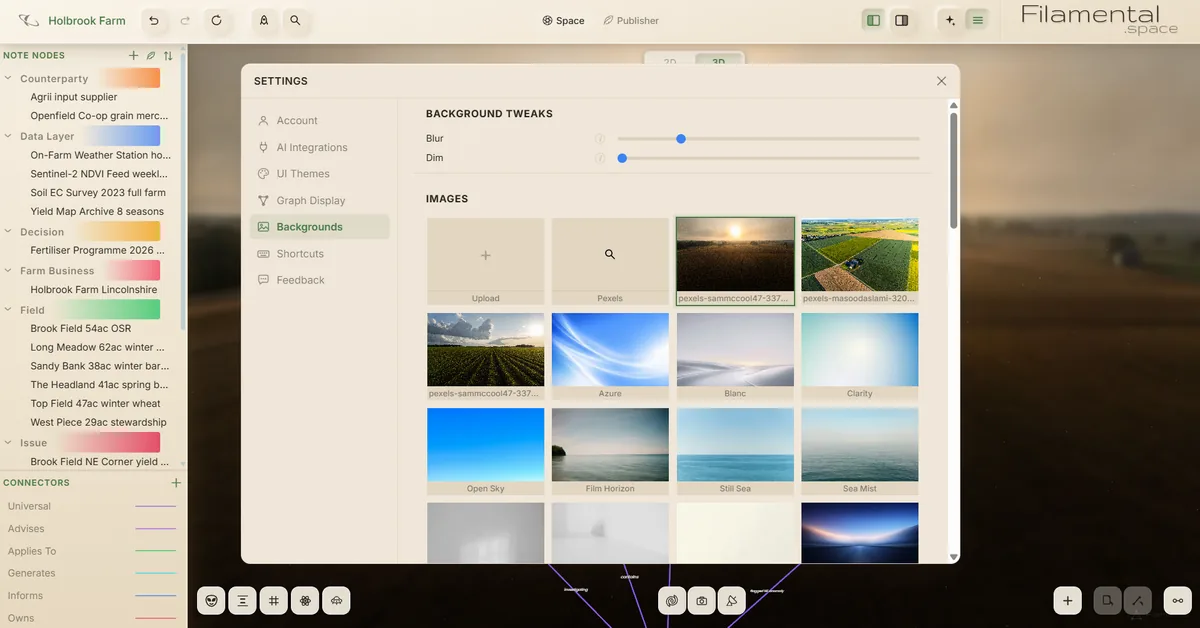
Two controls that matter when you choose an image are blur and dim. They exist so a background can be an image you actually like rather than a compromise, and the text stays readable. Customisation that costs you legibility is not a feature, it is a trade.

Backgrounds, with blur and dim The two sliders above the grid are the ones that matter. They are what lets the image be one you like rather than one that survives having text on it.
The Backgrounds panel in Settings. A grid of named canvas backgrounds sits under an Upload tile and a Pexels search tile, with Blur and Dim sliders above them, and the settings sidebar lists Account, AI Integrations, UI Themes, Graph Display, Backgrounds, Shortcuts and Feedback.

We add to the set fairly frequently, partly because people ask and partly because it is an enjoyable afternoon's work on a Friday.

The graph itself is adjustable in the same way. Pick fonts, size the cards and the connector labels, decide whether a node grows with the number of things it connects to, and cap how many nodes are drawn at once when a space gets large.
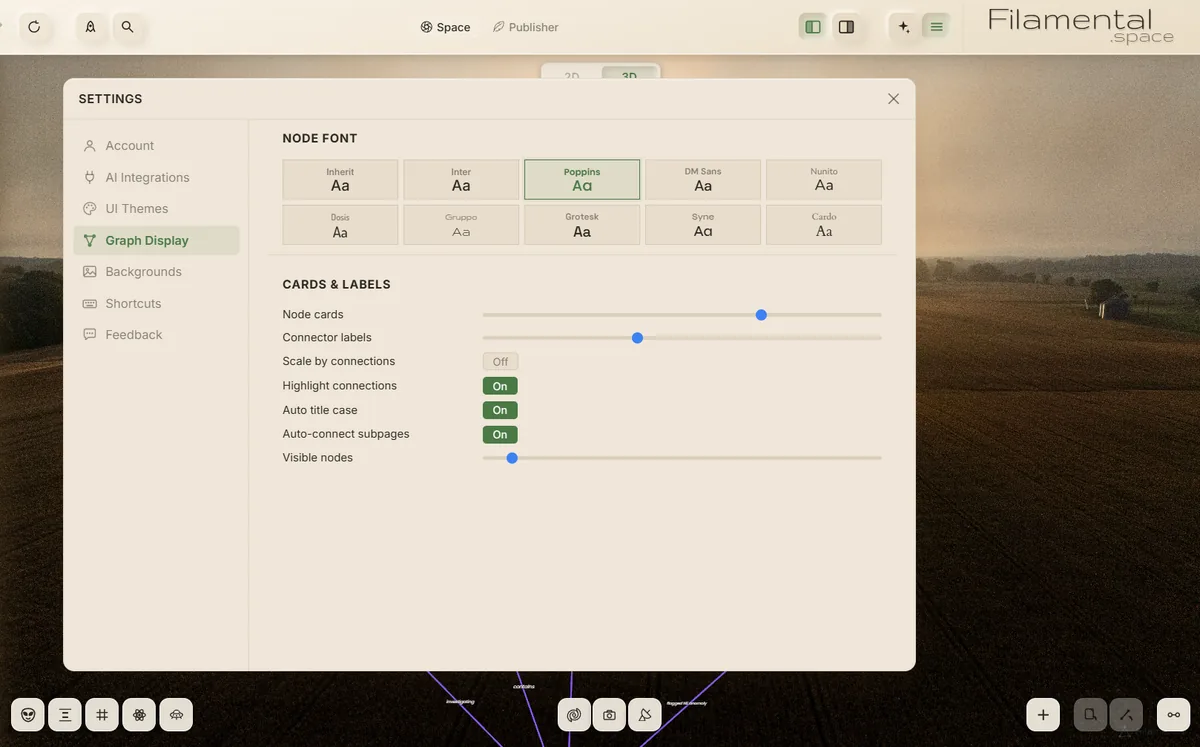
The graph itself is adjustable Ten node fonts shown as live samples, card and label sizes on sliders, and a cap on how many nodes are drawn at once when a space gets large.
The graph display settings open over a space. A Node font row offers ten typefaces as live samples, Inherit plus nine named faces, with one selected. Below it Cards and labels carries a slider for node card size, a slider for connector label size, and switches for Scale by connections, Highlight connections, Auto title case and Auto-connect subpages, then a slider setting how many nodes are visible at once.
Where you want it

A note can leave the panel and sit wherever you like

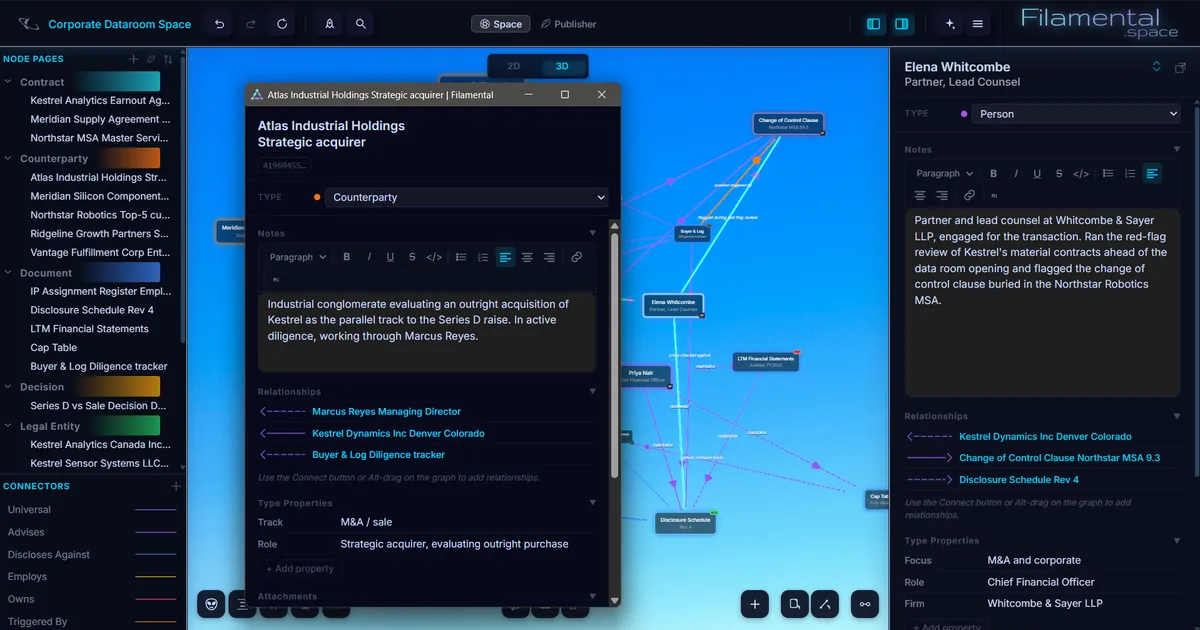
Pop a node out into its own window and put it where you want it. On two screens you can have multiple notes on one and the structure on the other. On one screen it is a note that can be Alt+tab'd between.

Two nodes open at once Atlas Industrial Holdings pulled out into its own window, with the graph still live behind it and the side panel still holding a different node entirely.
A node opened in its own floating window on top of the app. The window holds Atlas Industrial Holdings, typed as a Counterparty, with its notes, its three relationships and its type properties. Behind it the graph is still visible in 3D, and the right-hand panel is still showing a different node entirely.
Everything else

The rest of it, without the ceremony

The argument is above. This is the part that answers "yes, but does it actually do".

Every item on that list is in the free plan. We are aware of how that reads as a business plan. The part we charge for is on the publishing page, and it is the part that leaves your computer.

Start with a folder

The first space takes about a minute

No account, no card, nothing to cancel. Every install opens on Professional for fifteen days, and what follows it is a free plan that does not expire.

Version
0.3.36
Platforms
Win / macOS / Linux
Personal
Free, permanent
Professional
$120 / year